
Modbus Data Visualization
Thomas More - Energie Technologie · 2024
Smart Energy Monitoring:
Data Exchange with Modbus and Raspberry Pi
The challenge
For this project I developed a system to read out and visualise energy data from heat pumps and energy meters. The goal was to gain real-time insight into energy consumption and performance through a clear dashboard.
The challenge was to process data from the Modbus protocol, store it in a database and then display it efficiently. On top of that, I wanted to build a scalable and maintainable solution using Docker.
My approach
I used a Raspberry Pi 4 Model B with a Modbus USB adapter to read out data such as temperature and power consumption. A Python script collected this data and forwarded it to a database.
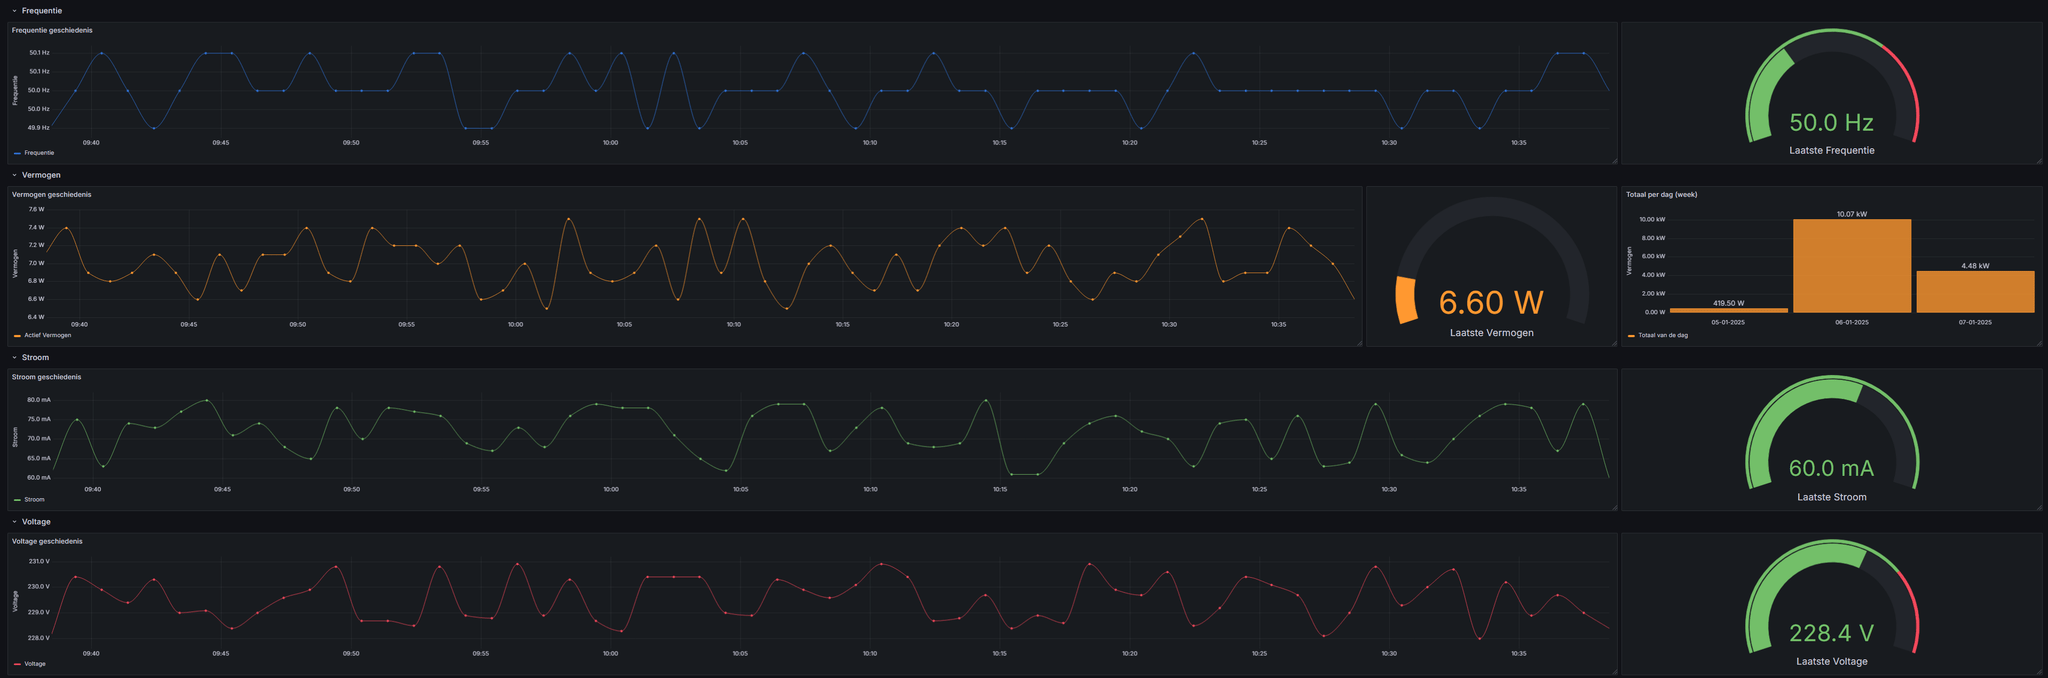
For the visualisation I set up a Grafana dashboard, which made real-time performance visible. I also used Docker to run all software components - the database, the Python script and Grafana - in containers, which made the solution scalable and easy to maintain.
The result
The end product was a fully functional energy monitoring system that allows energy consumption to be analysed and visualised in real time. This helps users gain better insight into their energy use and make optimisations.
What I learned
This project gave me valuable experience with industrial communication technologies such as Modbus, using a Raspberry Pi for IoT applications and implementing dashboards with Grafana. I also learned how Docker can help manage and scale software components more efficiently.